Our Research
Find below an overview of our research including themes, projects past and present, resources, and selections on compositional data analysis.
Research Themes
Functional Characterization of Microbiomes
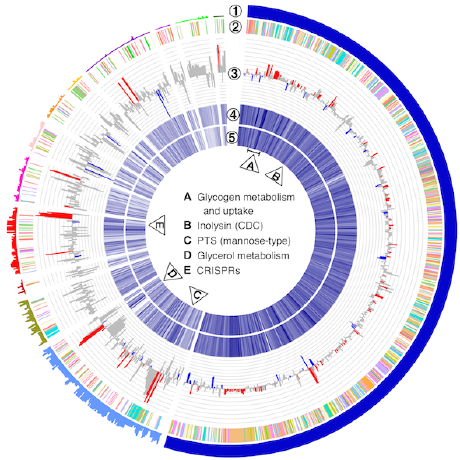
We are examining the composition and functional characteristics of microbial communities, and of coevolving networks in protein families. Currently, we examine the meta-transcriptome of vaginal, stool and maize microbial communities, and are connecting these results with those from other functional analyses such as metabolomics and proteomics.
Compositional Data Analysis
Interestingly, we have been able to show that many high-throughput sequencing experiments are best analyzed by combining Bayesian and compositional data approaches.
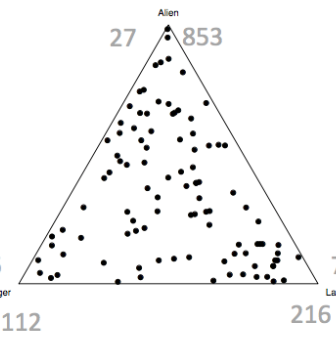
It is crucial to understand that HTS generates data where the actual read count is irrelevant because the reads for a given sample have a constrained sum. The constant sum problem in statistical analyses was recognized by Karl Pearson in the 19th century, but was largely ignored until recently. Using standard statistical tools on these types of data, as is common in metagenomics and transcriptomics, results in data where the results are unstable to re-coding, permutation, sequencing depth, and sub-setting.
Our approach is invariant to these since we convert the read counts to ratios that are stable no matter how the data is subset, rearranged or subdivided. With this approach we have successfully examined meta-transcriptomic datasets, 16S rRNA gene sequencing datasets, in vitro selection (selex) datasets and shown that the basic approach is broadly generalizable across many different HTS study designs.
Projects
ALDEx2
We developed and maintain the ALDEx2 package which uses the principles of Compositional Data analysis coupled with Bayesian inference to determine differential abundance between groups for transcriptome and microbiome datasets: Fernandes et al, 2013, Fernandes et al, 2014.
CoDaSeq
CoDaSeq is a suite of R functions for compositional analysis of high throughput sequencing.
The Effect Plot
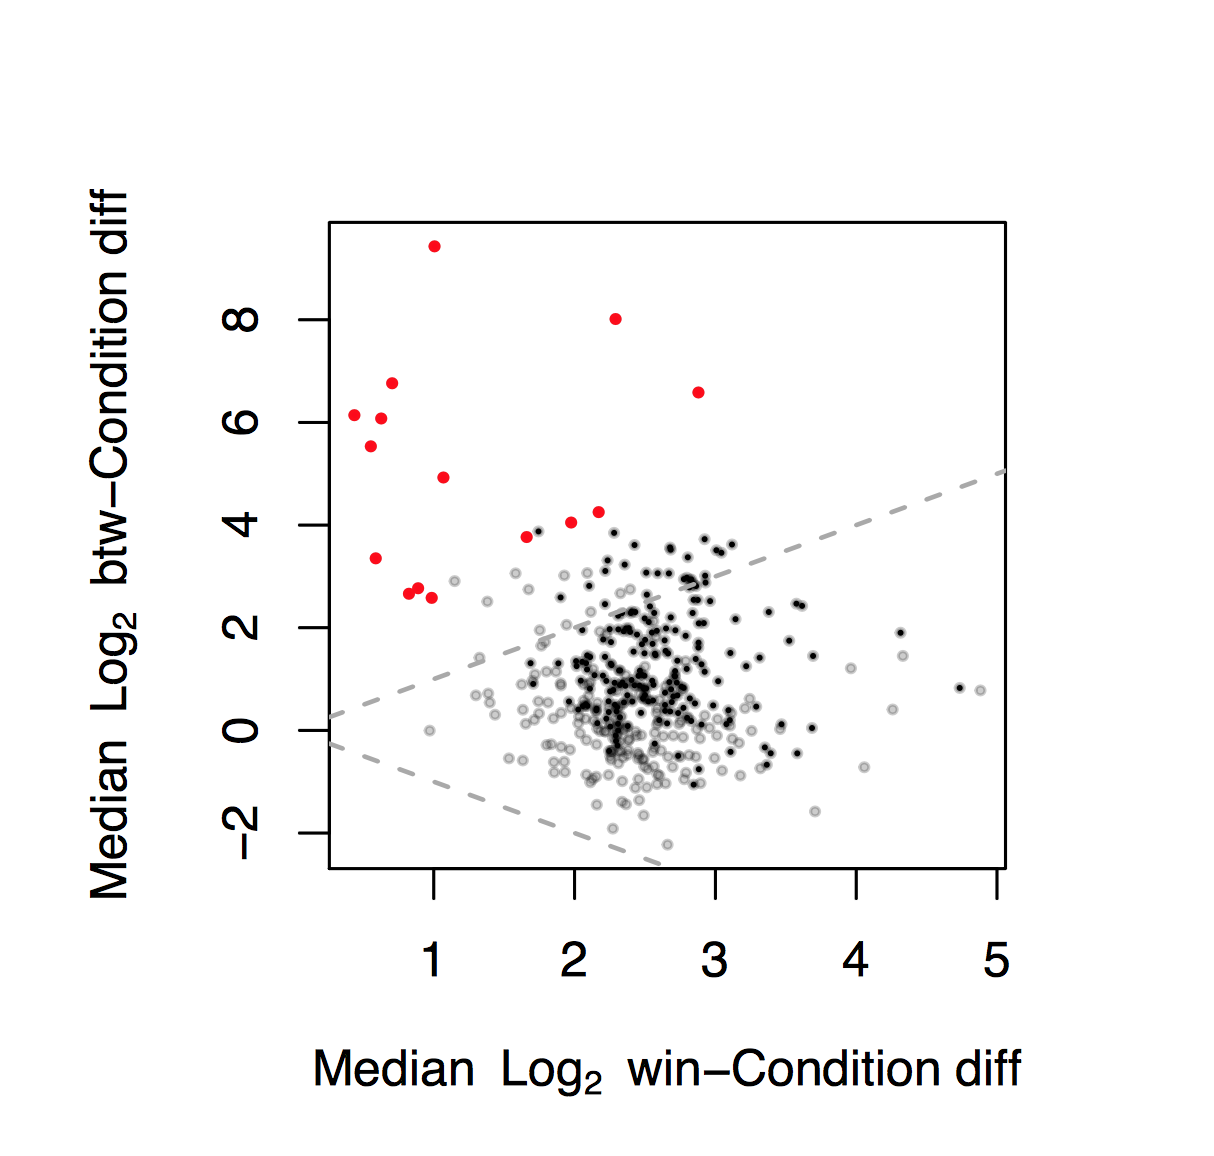
We have developed the 'effect plot', a useful graphical tool that shows the relationship between the within group dispersion and the between group difference. We find the plot to be a useful adjunct to Bland-Altman and Volcano plots: Gloor et al, 2015
In-line barcodes and workflow for 16S rRNA gene sequencing
We developed an inline combinatorial barcoding system for the Illumina HiSeq and MiSeq platforms. The below repository contains protocols and software. (Gloor et al, 2010;)
Selections
High throughput sequencing data is compositional by default, and should be analyzed as such. The below repositories and selections contain presentations and worked examples.


